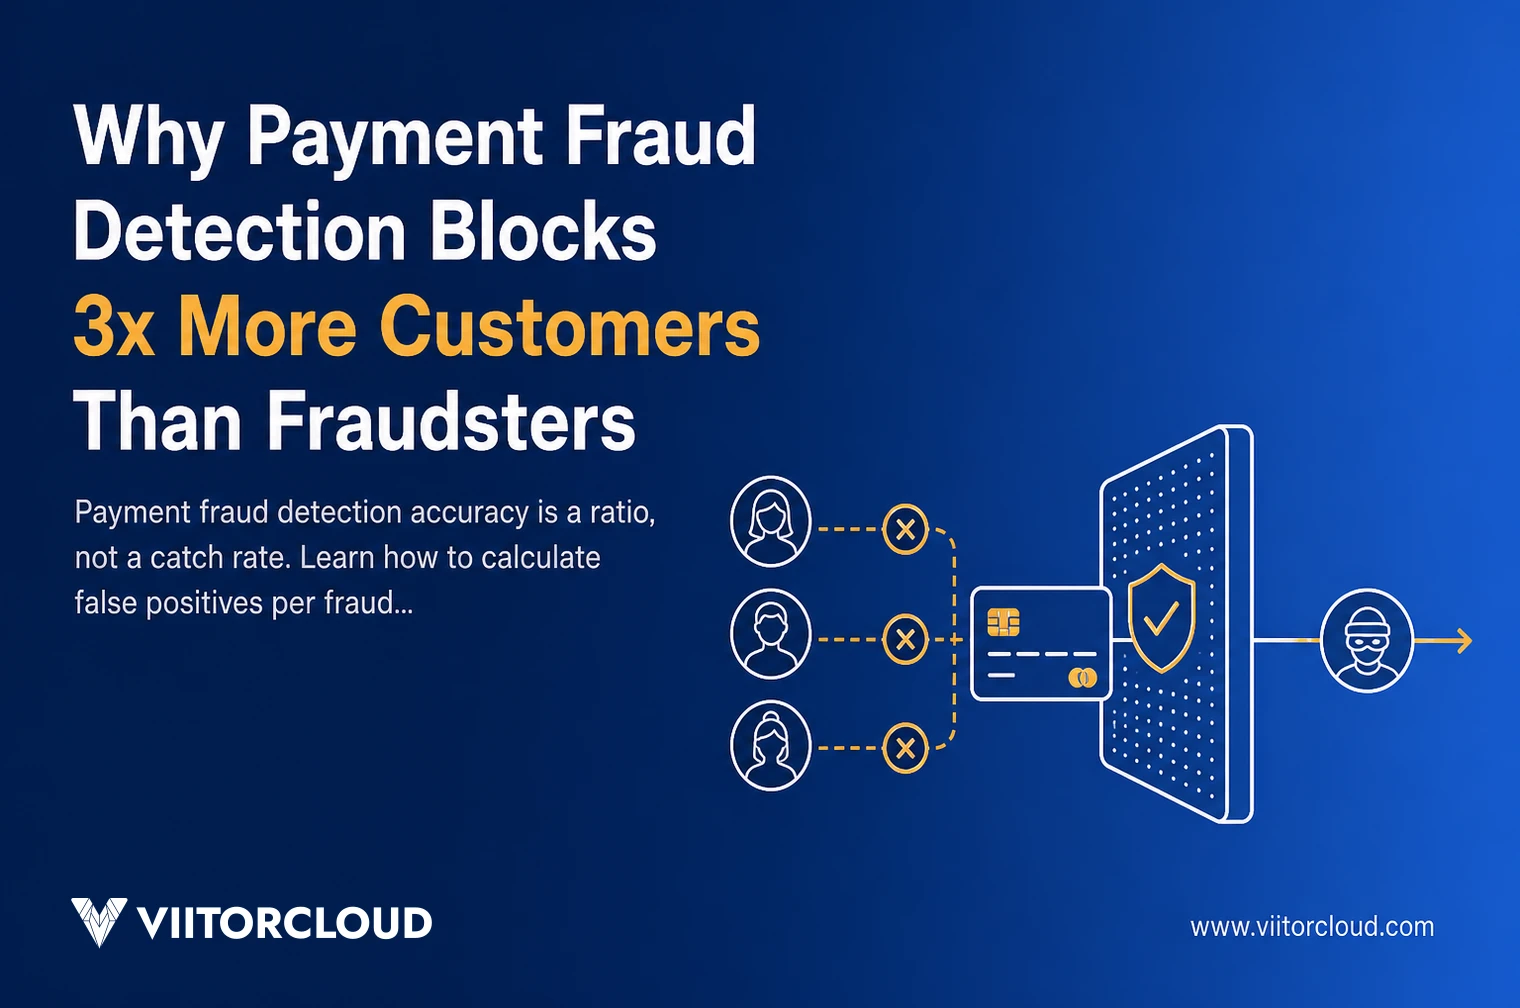
The most useful way to measure payment fraud detection accuracy is the ratio of false positives to true positives, not the catch rate. If your fraud model flags 2% of transactions and 1.5 percentage points of that are legitimate customers, you are blocking roughly 3 good buyers for every 1 fraudster you stop. That ratio decides whether your fraud program protects revenue or drains it.
Every payments leader I speak with can quote their catch rate from memory. Very few can quote the false positive rate sitting next to it. The catch rate is the number that gets reported upward, so it is the number that gets optimized, and tightening thresholds always makes it look better.
This article gives you three things. A calculation you can run on your own transaction monitoring data this week, the reason legacy engines manufacture false positives at scale, and what actually changes when AI fraud detection is tuned on the ratio instead of the rate.
Key Takeaways
- A fraud model that flags 2% of transactions with a 1.5% false positive share blocks 3 legitimate customers for every 1 fraudster caught.
- Legacy rule-based engines commonly run false positive rates between 30% and 70% of everything they flag, so catch rate gains often hide a growing revenue leak.
- The Trustpair 2026 Fraud Report found 71% of US companies saw an increase in AI-powered fraud attempts during 2025, and Signifyd recorded a 175% year-over-year rise in card testing attacks between January and April 2026.
- Mastercard reported that generative AI in its Decision Intelligence scoring lifted fraud detection rates by about 20% on average, by as much as 300% in some cases, alongside roughly a 30% reduction in false declines.
- Real-time fraud detection only pays off if the score returns inside the authorization window, which in practice means sub-100ms inference at p99 on fresh features.
How to Measure Payment Fraud Detection Accuracy Without Fooling Yourself
Payment fraud detection accuracy needs two numbers held together. Recall tells you what share of real fraud you caught. Precision tells you what share of your flags were real fraud. Catch rate on its own can be pushed to almost any figure by flagging more transactions, which makes it the easiest metric in the business to game.
The number that survives scrutiny is the false positive rate expressed per fraud caught. One fraudster stopped at the cost of one blocked customer is a defensible trade. One fraudster stopped at the cost of ten blocked customers is a policy decision nobody consciously approved.
Two costs sit behind every false positive, and only one of them appears in a fraud report. The first is the lost order. The second is the customer who never comes back, which across the BFSI platforms we engineer is almost always the bigger of the two.
Get Your False Positive Ratio Measured First
Before any model work, a two-week measurement pass over your last 90 days of flagged transactions tells you whether you are blocking one customer per fraudster or ten. Our engineers run it against your own transaction monitoring data.
Run the False Positive Ratio Before You Approve Another Fraud Model
This takes an afternoon with one query and a spreadsheet.
- Pull every transaction your transaction monitoring stack flagged in the last 90 days.
- Split them into confirmed fraud (true positives) and transactions later released, appealed, or manually approved (false positives).
- Divide false positives by true positives. That is your legitimate customers blocked per fraudster stopped.
- Multiply the false positive count by average order value, then again by your repeat purchase rate, to price the leak in revenue instead of in flags.
Three scenarios on a base of 100,000 transactions show how fast the ratio moves.
- Flag rate 2.0%, false positive share 1.5%. 2,000 flags split into 1,500 legitimate customers and 500 fraud attempts. Ratio 3 to 1.
- Flag rate 1.0%, false positive share 0.6%. 1,000 flags split into 600 legitimate customers and 400 fraud attempts. Ratio 1.5 to 1.
- Fraud rate 0.1%, legitimate block rate 1.0%. Around 999 blocked customers against 100 fraud attempts. Ratio close to 10 to 1.
A head of payments, I reviewed an architecture with, call him Daniel, ran step three across a book doing about $400M in annual volume. His engine’s catch rate had improved for three straight quarters. His ratio was 6 to 1. The chargeback line looked healthy because the decline line was absorbing the damage, and the decline line reported to a different team.
Why Rule-Based Engines Manufacture False Positives at Scale
Static rules cannot separate unusual from fraudulent. A rule that blocks a first-time buyer on a new device in a new country catches fraud, and it also catches a business traveller placing a large legitimate order. Every rule added after an incident pushes the false positive rate higher, and almost nobody removes rules.
The attack side is moving faster than the rule side. The Trustpair 2026 Fraud Report put the share of US companies seeing more AI-powered fraud attempts at 71% for 2025. Signifyd counted a 175% year-over-year rise in card testing attacks between January and April 2026. Rules written against last year’s patterns are being probed by systems that adapt within hours.
Measurement discipline comes before modelling. If risk, operations, and finance classify the same disputed transaction differently, the ratio you calculate is fiction. The Federal Reserve’s FraudClassifier model gives payments teams a shared vocabulary for classifying fraud events, and agreeing on it internally is the unglamorous prerequisite to every honest fraud metric.
Why B2B Payment Fraud Breaks the Usual Ratios
B2B payment fraud behaves differently. Volumes are lower, ticket sizes are far larger, and the dominant vectors are vendor impersonation, invoice redirection, and compromised email rather than stolen cards. At a few thousand payments a month, a count-based ratio swings wildly from week to week.
For B2B payment fraud, measure the ratio in currency instead of in transactions. One blocked $180,000 supplier payment can cost more in delivery delays and relationship damage than a hundred blocked consumer checkouts, and it will never show up as a chargeback. Payee validation and hybrid automation across payment operations handle more of that risk than a scoring model does.
Build Fraud Scoring on Your Own Transaction Data
Off-the-shelf rules are trained on generic patterns, not your customers. We build custom AI solutions that score in real time, return reason codes reviewers can act on, and learn from every released false positive.
What Changes When AI Fraud Detection Is Tuned on the Ratio
Machine learning does not fix the ratio on its own. It fixes the ratio when the ratio is the training objective and the review loop is built around it. Mastercard reported that adding generative AI to its Decision Intelligence scoring improved fraud detection rates by an average of 20%, and by as much as 300% in some cases, with roughly a 30% reduction in false declines from the same program. The detection gain is the headline. The decline reduction is the money.
Four engineering decisions carry most of that improvement.
1. Decisions inside the authorization window:
Fraud detection in a payment gateway has to answer in tens of milliseconds. A model that needs 400ms gets bypassed under load, and the bypass path is where losses concentrate.
2. Fresh features instead of stale aggregates:
Velocity counts computed overnight cannot see a card testing burst that starts at 2 am. Streaming features are what keep the score current.
3. Explainable scores:
Reviewers, chargeback teams, and regulators all need reason codes. A score without reasons cannot be appealed, tuned, or defended, which is a recurring theme in AI security and risk management in banking.
4. A human in the loop that feeds back:
Every released transaction is a labelled false positive. If those labels never return to training, the model repeats the same mistake next month.
The hard part is rarely the model. It is the data path underneath it, which follows the same pattern as any production system built on real-time data architecture for AI and ML development. Pipeline first, then scoring.
A fraud operations lead I worked with, Priya, inherited a queue of roughly 4,000 flagged transactions a week with a release rate above 90%. That release rate is the false positive rate wearing a different label. The change that mattered was not a better model. It was pushing velocity features into the scoring path in real time and giving reviewers reason codes, so the obvious releases stopped entering the queue at all.
The Three Numbers I Ask For Before Touching a Fraud Model
1. Decline-to-chargeback ratio:
If declines are rising faster than chargebacks, the fraud model is buying safety with revenue.
2. Manual review release rate:
Anything above 80% released means the model is delegating its own uncertainty to people, and AI-driven automation in the review queue pays back quickly at that level.
3. p99 scoring latency:
Averages hide timeouts. The p99 is what your payment gateway fraud detection path actually experiences at peak.
Those three fit on one slide, and together they say more about a fraud program than any catch rate chart.
Start With a Scoped Proof of Concept
We have engineered payment platforms handling $7.1M in 72 hours and $192.2M in processed healthcare revenue. Validate the approach on one slice of live traffic before committing to a full fraud engine rebuild.
Where I Would Start If Declines Are Rising Faster Than Chargebacks
Systems that hold up under peak load are the ones designed for it. A travel and deals platform we built processed $7.1M in revenue in 72 hours during a single Black Friday window and 56,943 orders across 2024, which is exactly the traffic shape where badly tuned rules destroy conversion. A healthcare revenue cycle platform we engineered has processed $192.2M in payments. Real-time scoring at that volume rests on the same ingestion discipline behind an IoT deployment of ours that extracts 1M data points a day from 15,000 sensors.
If your ratio is worse than 3 to 1, the first piece of work I would scope is a two-week measurement pass over your existing flags, before anyone proposes a new model. After that, custom AI solutions trained on your own transaction history are what move the number. Bring your ratio to a technical conversation with our AI engineers, and we at ViitorCloud will tell you whether you have a data problem or a model problem.
What Good Payment Fraud Detection Actually Optimizes For
Three things to take away. Catch rate on its own is a vanity metric, because you can move it any time by flagging more transactions. The false positive to true positive ratio is the number that connects fraud policy to revenue, and you can calculate yours in an afternoon. A fraud model only improves that ratio when the data path, the latency budget, and the review loop are engineered together.
Run the ratio on your last 90 days before your next fraud review. If you are blocking three customers for every fraudster, payment fraud detection has stopped being a security question in your business. It is a growth question, and it belongs on the same agenda as conversion.

Vishal Shukla
Vishal Shukla is Vice President of Technology at ViitorCloud Technologies.
Frequently Asked Questions
How do you measure payment fraud detection accuracy?
Measure it as the ratio of false positives to true positives, not as a catch rate. Pull 90 days of flagged transactions, split them into confirmed fraud and released transactions, then divide the released count by the confirmed count. That gives you legitimate customers blocked per fraudster stopped.
What is a good false positive rate for fraud detection?
How does AI fraud detection work?
What is an acceptable fraud detection latency?
How is B2B payment fraud different from consumer card fraud?