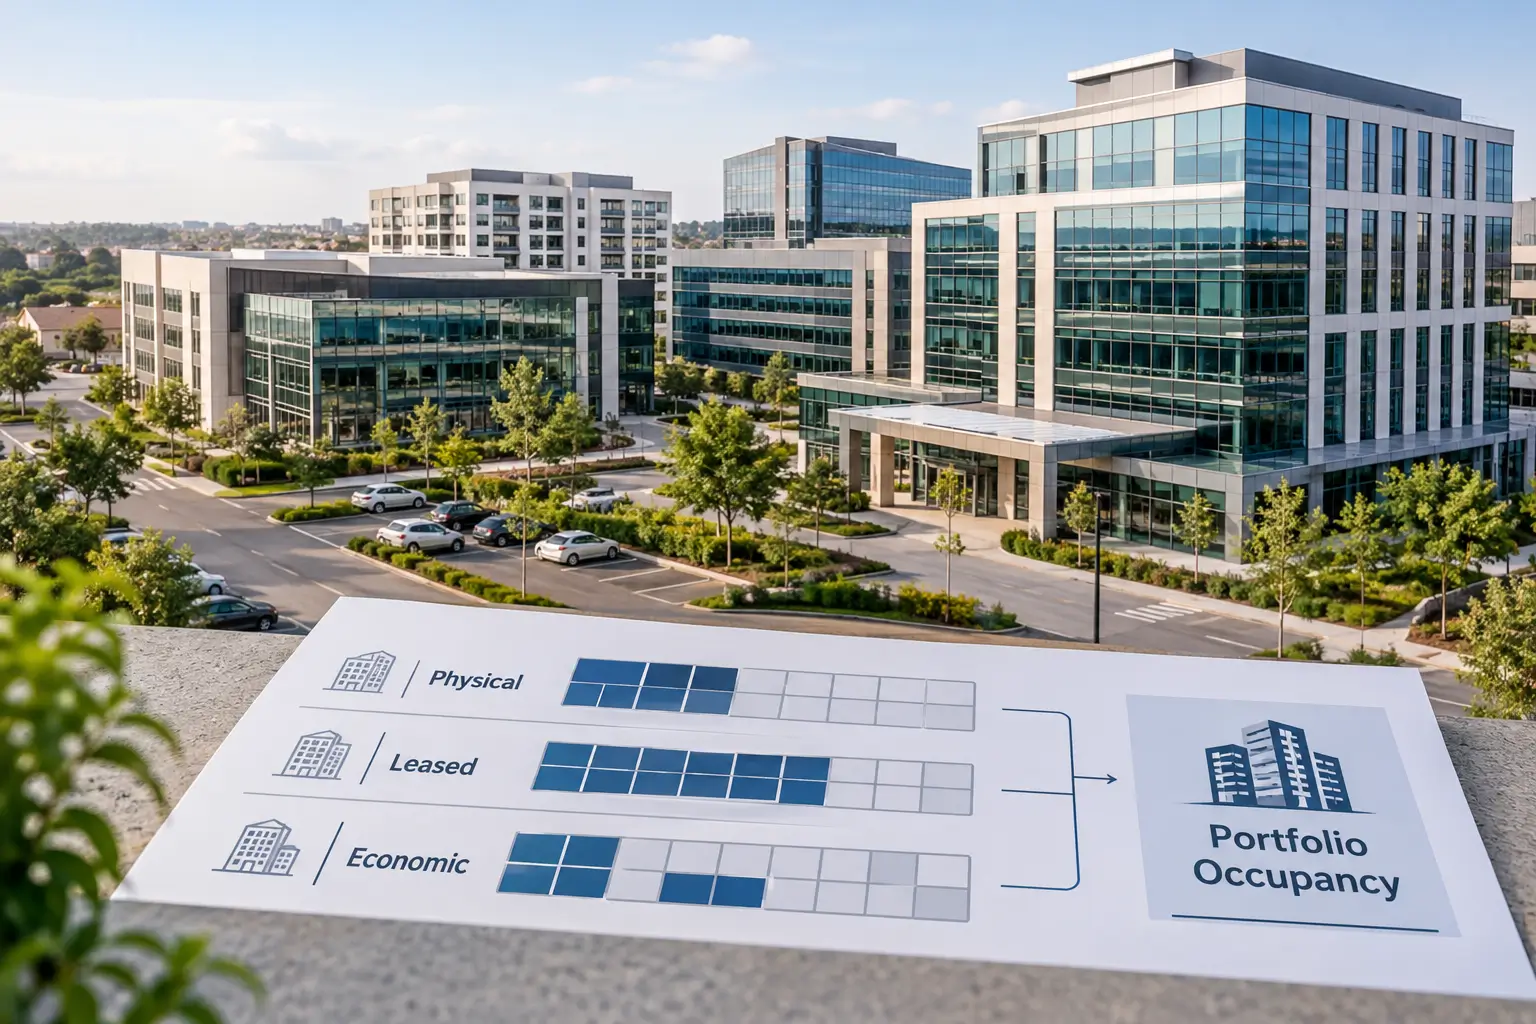
Power BI consulting earns its fee in real estate when it gives a portfolio one occupancy number that the site manager, the controller and the board all calculate the same way. Plenty of property teams don’t have that yet. A typical (illustrative) picture: a leasing report showing 94%, a finance pack showing 89%, and an asset manager’s spreadsheet landing at 91%.
Each figure holds up on its own. The trouble starts when all three reach the same meeting. Someone asks which one is right, and the room goes quiet while three people explain three formulas.
Our view is blunt: the dashboard is the last problem to solve. The definition comes first. Then the data path. Visuals come after both are settled, and they’re the easy part.
Key takeaways
- “Occupancy” is at least three different measures. Physical, leased, and economic occupancy answer different questions, and a report has to say which one it shows.
- Power BI consulting should start with a written KPI definition, signed off by the people who report it, before anyone builds a visual.
- Most occupancy errors enter between the property system and the board deck, in lease files, monthly spreadsheets and manual overrides.
- A certified semantic model plus a reconciliation page lets anyone trace a portfolio number back to its source.
- Copilot in Power BI will repeat whatever your model says, so AI readiness depends on the same definition of work.
Why does one portfolio produce three occupancy numbers?
One portfolio produces three occupancy numbers because “occupancy” covers at least three measures, and property teams rarely write down which one they mean. Physical occupancy counts occupied space. Leased occupancy counts signed space, including tenants who haven’t moved in. Economic occupancy compares rent collected with rent you could collect. Each answers a different question.
Here’s how they differ in practice:
- Physical occupancy: occupied square feet or units divided by total square feet or units. It tells you how full the building is today.
- Leased occupancy: space under a signed lease divided by total space. It counts the tenant moving in next month and the one who has already given notice.
- Economic occupancy: rent collected divided by gross potential rent. Free-rent periods, concessions, bad debt and below-market leases all pull it down.
Data from two public sources shows how far apart these measures can drift. Kastle Systems’ Back to Work Barometer put its 10-city office occupancy average at 56.4% in early November 2026, based on keycard entries compared with a February 2020 baseline. Nareit’s REIT Industry Tracker reported 88% occupancy for REIT-owned office properties in Q2, 2026. Both are correct, because Kastle counts people entering buildings, and Nareit counts leases in force.
The same split happens inside a single company, just on a smaller scale. A leasing team marks a unit occupied by the day the lease is signed. Property management waits for the move-in date. Finance treats a tenant in a six-month rent-free period as occupied space that earns zero. Nobody is wrong. But the portfolio total changes depending on whose definition fed the deck, and that’s the problem real estate teams across residential and commercial portfolios keep running into.
Three Occupancy Numbers in One Board Pack?
Agree one definition for each portfolio KPI and trace it back to your property systems. Our BI consulting services team maps where your occupancy figures split and fix the logic at the source.
What should Power BI consulting fix first in real estate?
Power BI consulting should fix the definition first. Before anyone builds a visual, the engagement should produce one written definition for each occupancy to measure the business’s reports, with the formula, the source field, the inclusions and exclusions, and a named owner. If the dashboard comes first, the teams still disagree, and the disagreement now appears in every meeting.
We’d push back on any brief that opens with “we need an occupancy dashboard by month-end.” That brief reads a reporting request, but it needs governance to work first. If the leasing director and the controller haven’t agreed what counts as occupied, the consultant ends up picking a definition for them, and the first board meeting turns into a debate about the consultant’s choice.
A one-page KPI definition for economic occupancy
This is the level of detail a definition needs. One page per measure is enough.
| Field | Example entry |
| Metric name | Economic occupancy |
| Formula | Rent collected for the period ÷ gross potential rent for the period |
| Source system and field | Property management system rent roll; charge codes for base rent only |
| Included | Base rent, rent from tenants on payment plans |
| Excluded | Recoveries, parking income, one-off fees |
| Owner and sign-off | Head of asset management; controller co-signs |
The owner matters more than the formula. When a number looks odd in March, someone has to be the person who answers it. Without a name, the question bounces between teams until the next reporting cycle buries into it.
Where does the occupancy number break on its way to the board?
The occupancy number usually breaks in the handoffs: between the property management system and the lease files, between those files and the monthly spreadsheet, and between the spreadsheet and the deck. The source system is rarely the main culprit. Manual steps in the middle are where definitions quietly change.
In the property management system
Sites use unit status codes differently. One property marks a unit “vacant-ready” after cleaning. Another skips that status entirely. Rolled up, the portfolio vacancy count depends on habits nobody documented.
In the lease file
Lease dates, free-rent periods, and break clauses often live in PDFs, not structured fields. Real estate paperwork is often inconsistent, which is why extracting dependable data from it is hard engineering work. ViitorCloud ran into this on Klaviss, a US real estate transaction platform, where inconsistent documents made reliable OCR extraction the toughest part of the build.
In the monthly spreadsheet
Here’s where most quiet edits happen. An analyst excludes a building under renovation for one month and forgets to exclude it the next. Someone marks a tenant in dispute as occupied “for now.” Each fix is reasonable. Together they make month-to-month trends unreliable.
In the board deck
Once numbers reach the slides, they’ve been rounded, re-labelled and sometimes averaged across properties of very different sizes. A simple average of property occupancy rates gives a 20-unit building the same weight as a 400-unit one. That alone can move a portfolio figure by a few points.
What does trustworthy real estate portfolio analytics look like in Power BI?
Real estate portfolio analytics you can trust in Power BI rests on one shared semantic model, the layer that holds your tables, relationships and calculations, with each occupancy measure defined once. Every report is read from that model. Certification marks it as reviewed; row-level security controls who see which assets, and a reconciliation page shows how the different occupancy measures relate.
One semantic model behind every report
Write the occupancy measures once, in DAX (Power BI’s formula language), inside a shared model. Leasing, finance and asset management build their own reports on top. If someone needs a different cut, they apply a filter to the shared measure, and the formula stays the same. This is the change our data analytics services team pushes for first, because it stops definitions of drifting team by team.
Certification a person has reviewed
Power BI lets administrators restrict who can certify content. Microsoft’s documentation says certified content “can be regarded as reliable, authoritative content.” That only holds if certification follows a real review against the signed definition. Record who certified the model and which signed definition they checked it against.
A reconciliation page nobody can hide from
Put physical, leased, and economic occupancy side by side for every property, with the gap explained. Good data visualization services earn their keep here, because a clear bridge chart from leased to economic occupancy explains the gap faster than a table. Pending move-ins explains the space between leased and physical. Concessions and arrears explain the space between physical and economic. When a board member asks why the numbers differ, the answer sits on one page.
What Power BI consulting should hand over at the end
Ask for these in writing before the engagement starts:
- Signed KPI definitions for each occupancy measure, with owners.
- A certified semantic model with measures documented in plain language.
- A reconciliation report comparing the occupancy measures by property and month.
- A refresh and exception log that shows when data loaded and which records failed checks.
- A handover session so your team can add a property or change a definition without calling the vendor.
What does the research say about trusting business metrics?
The research says most organizations link their data to business goals in principle but measure that link far less often. That gap shows up directly in occupancy reporting. Governance makes a measurable difference to how much leaders trust their data, which is the outcome business intelligence services for real estate should be chasing.
The 2026 State of Data Integrity and AI Readiness study from Drexel University’s LeBow College of Business and Precisely surveyed more than 500 senior data and analytics leaders at large US and EMEA organizations in late 2025. Only 31% said they have actual metrics tied to KPIs. Organizations with a data strategy and governance program reported high trust in their data 71% of the time, against 50% for those without one.
The figures are self-reported and skew toward large enterprises, so treat them as directional. Still, the pattern matches what happens in property portfolios. Occupancy is a KPI. If it isn’t defined, owned and governed, the board will keep questioning it no matter how the dashboard looks.
Make Occupancy a KPI Your Board Trusts
Turn signed definitions into one certified Power BI model for your leasing, finance and asset teams share. We build real estate portfolio analytics your controller can trace line by line.
Power BI consulting or an in-house build: which suits your portfolio?
Power BI consulting suits portfolios with three or more source systems, acquired assets on different platforms, or no internal owner for KPI definitions. An in-house build suits teams that already have a BI developer, one property management system and agreed definitions. The deciding factor is usually who can run the definition of work across departments.
| Situation | In-house build | Outside BI consulting services |
| One property management system, definitions agreed | Usually enough | Optional review |
| Acquired portfolios on different systems | Hard without integration skills | Strong fit |
| No one owns KPI definitions | Stalls on politics | Neutral facilitator helps |
| Board or investor reporting under scrutiny | Possible with review | Independent check adds weight |
| Team needs to maintain it long term | Natural owner | Requires a proper handover |
There’s a middle path, too. Some teams bring in a partner for the definition and model design, then hire a data analytics developer to extend reports once the model is stable. That way an outside facilitator handles the cross-team definition work, and your own developer handles day-to-day changes.
A 30-day occupancy trust check you can run yourself
This is an editorial framework, not an industry standard. It’s a short way to find out how much of your occupancy reporting you can defend before you spend money on dashboards or data visualization services.
- Week 1, collects every version. Pull the occupancy figure for one month from every report that shows it: leasing, finance, asset management, investor reporting. Write down the number and who produced it.
- Week 2, write down each formula. Ask each producer how they calculated it. Note which units or buildings they excluded and why. You’ll usually find three or four definitions.
- Week 3, trace five properties. Pick five assets of different sizes. Follow each number from the property system to the deck and log in to every manual step.
- Week 4, agree and assign. Bring the producers together, agree which measure each audience needs, and name an owner for each definition.
At the end, you’ll have a short list of definitions, a map of manual steps, and a clear brief. Hand that brief to a consultant and the first proposal can price the real work.
CTA banner (HTML):
Finished the Trust Check? Build on It
Bring your definitions and manual-step map to our team. We turn them into a Power BI consulting plan with a certified model, a reconciliation report, and a clear handover to your analysts.
Will Copilot in Power BI fix bad occupancy data?
No. Copilot in Power BI answers questions from your semantic model, so it repeats whatever definitions and errors already sit there, only faster and in plain English. If your model holds three occupancy formulas, Copilot can quote any of them with confidence. The definition of work has to come first.
This matters more now because Microsoft is steering users toward Copilot. Its documentation notes that the older Q&A experience is being retired in February 2027. Microsoft also offers verified answers, where a model’s author approves a visual response to common questions, so Copilot returns that answer instead of generating a new one.
For a property team, that means “What’s our occupancy?” can return the approved economic occupancy view every time, whoever asks. Verified answers are only as good as the definition behind them, which brings you back to the signed KPI page.
What to ask before you hire a BI consulting services partner
Ask how they handle disagreement between teams about KPI definitions, since that decides the project more than report design does. A good partner will ask for your definitions before quoting, explain how they reconcile sources, and show how your team maintains the model after handover. If the first proposal is a dashboard mock-up, the hard work hasn’t been scoped.
Whichever data analytics company you shortlist, put these questions in writing:
- Definitions: Who facilitates the KPI agreement, and what do you deliver at the end of it?
- Sources: How will you reconcile the property system, lease data and finance figures?
- Certification: Who on our side certifies the model, and what review do they follow?
- Handover: Can our analysts add a property or change a definition without you?
- Exit: Do we own the model, the documentation, and the definitions outright?
ViitorCloud is a data analytics company that has worked with 300+ customers since 2011, often alongside the client’s own team. In BI work, our part covers the definition, modelling and handover, and your people keep ownership of the numbers.
One relevant example sits outside of real estate. On a resource management tool built inside a client’s Microsoft environment, project hours scattered across teams were brought into one portal with live calculations, using Microsoft sign-in and PowerApps connections. Occupancy reporting has the same problem, with records spread across teams that need to roll up into one figure.
Could your team explain today’s occupancy number line by line?
If the honest answer is “it depends on who you ask,” that’s the place to start. Bring us the versions you found in your trust check, and we’ll help you agree with the definitions and build a Power BI model that holds them. Talk to our team about Power BI consulting for your portfolio.

Vishal Shukla
Vishal Shukla is Vice President of Technology at ViitorCloud Technologies.
Frequently asked questions
What does a Power BI consultant do for a real estate company?
A Power BI consultant, usually working within a wider business intelligence services engagement, helps a real estate company agree how each KPI is calculated, connects the property, lease and finance data behind it, and builds a shared model that every report uses. The good ones also certify the model, document the definitions in plain language, and train your team to maintain it after handover.
What is the difference between physical, leased, and economic occupancy?
How long does a Power BI consulting engagement take for a property portfolio?
Do we need a data warehouse before using Power BI for real estate reporting?
Should occupancy data be certified in Power BI?