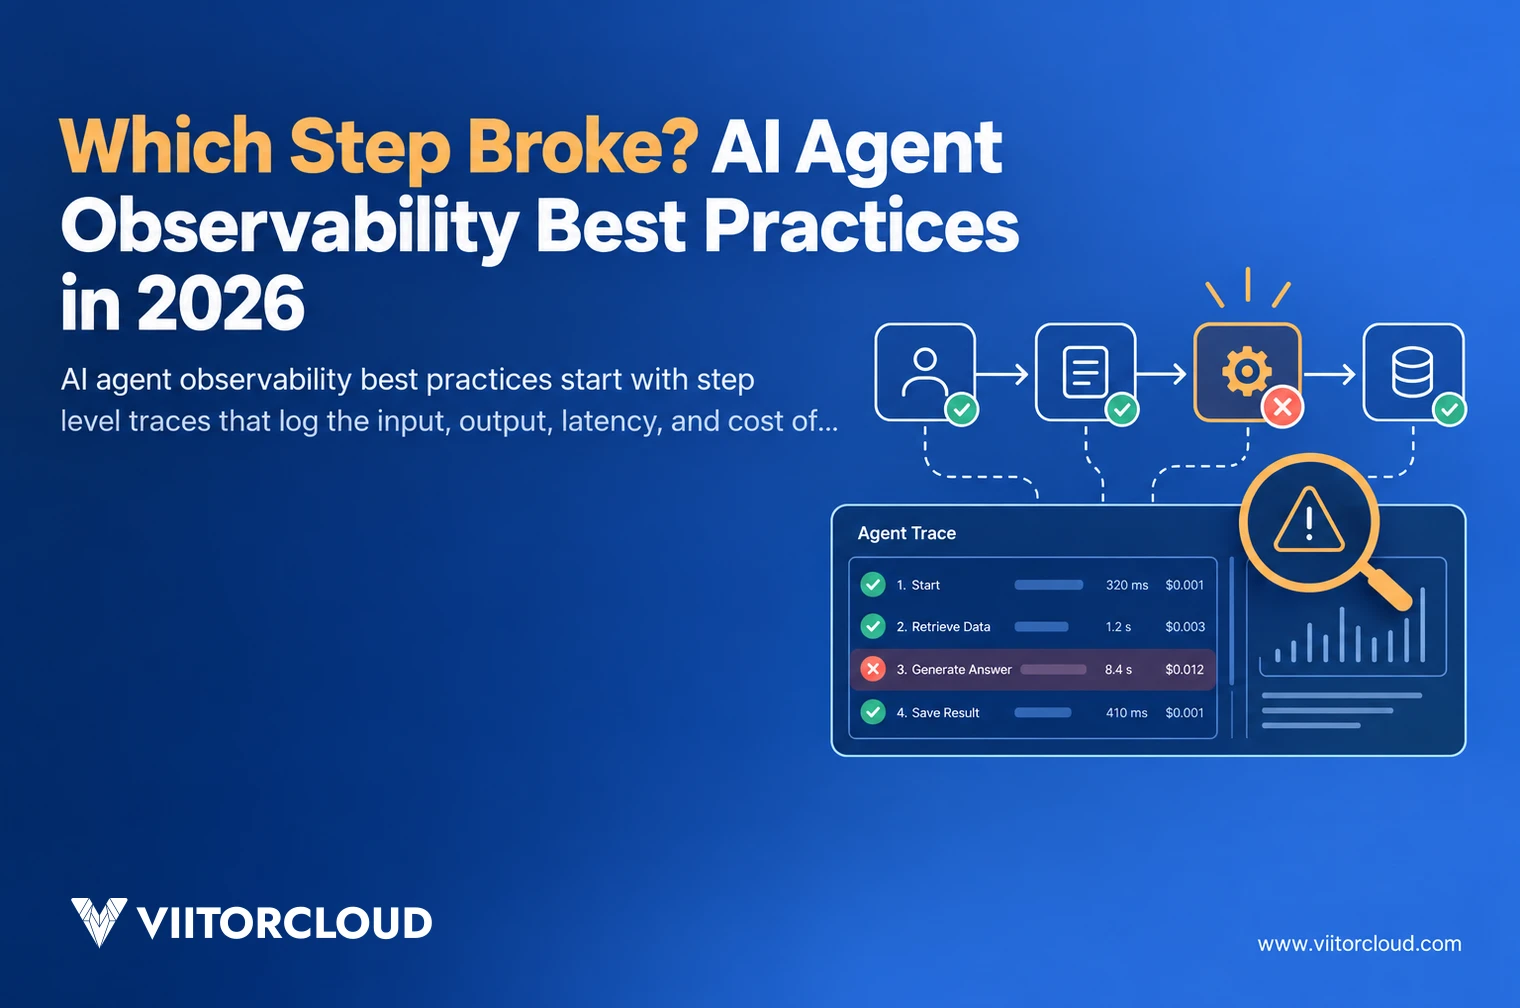
To debug a multi-step AI agent, read the trace, not the prompt. Sound AI agent observability best practices record the input, output, latency, token count, and cost of every single step, so you can point to the exact call that produced the wrong answer instead of guessing at it.
Here is the situation I keep walking into. An agent called six tools, returned a confident answer, and the answer was wrong. Nobody on the team can say which step broke.
The retrieval may have pulled a stale document. A tool may have returned an empty array that the model quietly read as zero. The plan may have skipped a step, or the summary may have invented a number over a correct result. From the outside, all four failures look identical.
This article covers what to log at every agent step, how agent tracing exposes the break, how per-route cost tracking keeps the bill legible, and how to choose tooling without buying three products. The logging spec in the middle is written to be copied and sent to your own team.
Key Takeaways
- A single model call is inspectable from its input and output. A six-step agent run is not, because the failure can originate in retrieval, a tool response, the plan, or the final summary.
- Step-level logging is the foundation of AI agent observability best practices. Record trace ID, step type, input, output, latency, model, token counts, cost, and status on every step.
- Agent tracing links those steps into one parent run, which is what turns a vague complaint into a named span, such as step four returning an empty array.
- Per-route cost tracking attributes spend to the workflow that caused it, so a 40% invoice increase becomes a named route rather than a mystery.
- Review three traces every week. The slowest run, the most expensive run, and one run that reported success and was still wrong.
Why One Wrong Answer From a Six Step Agent Is So Hard to Explain
A single model call has two artifacts: the prompt and the completion. If the answer is wrong, you read both, and you usually know why within a minute.
An agent run has no such symmetry. Six steps produce at least twelve artifacts, plus the routing decisions between them, plus whatever the retrieval layer returned that the model chose to ignore.
Four failure origins account for most of what I see in production:
- Retrieval: The right document exists but ranked seventh, so the model reasoned over the wrong context.
- Tool response: The API returned a 200 with an empty payload, and the model treated absence as zero rather than as an error.
- Plan: The agent decided a step was unnecessary and skipped it, which stays invisible unless you log the plan itself.
- Summary: Every step succeeded, and the final synthesis reported a figure that appears nowhere upstream.
Take a freight booking agent that quotes a lane. It checks a rate table, calls a carrier API, applies a fuel surcharge rule, and writes the quote. When that quote comes back 18% low, the operations lead has four suspects and no evidence.
The default response is to change the system prompt and watch for a week. That is not debugging. It is a slow experiment with no control group, and it is the most common failure mode I see in teams running custom AI solutions in daily operations.
AI Agent Observability Best Practices Start With Step-Level Logging
Every one of the AI agent observability best practices below reduces to one rule. If a step happened, it produced a record, and that record is queryable.
Step-level logging is not application logging with extra fields. Application logs answer whether the service stayed up. Step-level logging answers what the agent believed, what it asked for, what it got back, and what it did next.
This is the spec I hand to platform teams. Record all of it, at every step, on every run:
- Identity: trace_id, step_id, parent_step_id, run number, and the route or workflow name.
- Step type: plan, retrieval, tool call, model call, guardrail check, or final synthesis.
- Input: The exact payload sent, with sensitive fields redacted at write time rather than at read time.
- Output: The exact payload returned, including empty results, which are the ones that hurt.
- Timing: Start timestamp, end timestamp, and latency in milliseconds for that step alone.
- Model detail: Model name, model version, temperature, and the tool schema version in play.
- Tokens and cost: Prompt tokens, completion tokens, cached tokens, and the resolved cost of the step.
- Status: success, error, timeout, retry, or truncated, with the retry count attached.
- Retrieval detail: Query text, document IDs, similarity scores, and how many chunks reached the context window.
- Guardrail verdicts: Which policy ran, what it returned, and whether it blocked or passed the step.
- Evaluation: Any automated score from a judge model or rule, stored on the step rather than on the run.
Two of those fields carry most of the diagnostic weight. Empty output paired with a success status sits behind a large share of silent wrong answers. Similarity scores tell you whether retrieval failed or whether the model ignored good context.
Redact at write time. Regulated healthcare and financial workflows cannot hold raw payloads in a trace store, and retrofitting redaction after an audit finding costs far more than building it in on day one.
See What Step Level Traces Look Like on a Live Agent
We instrument agent runs span by span, from the first user message through every tool call, retrieval, and summary. Review how the same discipline is applied across our custom AI work.
What Agent Tracing Shows You That a Prompt Change Never Will
Agent tracing is step-level logging with the parent and child relationship preserved. One run becomes one trace. Each step becomes a span nested under the step that called it.
That structure matters because agent failures are relational. A tool returned a 200 in 40 milliseconds, and the model still produced nonsense, which tells you the payload was empty rather than the API being down.
Three practical rules for agent tracing:
- Propagate one trace ID from the first user message through every downstream call, including calls into systems that predate the agent.
- Span the plan itself, not only the tool calls, so a skipped step leaves a record of the decision that skipped it.
- Store the raw tool response next to the model interpretation of it, because the gap between those two is where most wrong answers live.
Instrument against an open standard rather than a proprietary schema. The OpenTelemetry project publishes semantic conventions for generative AI spans covering model, token, and tool attributes. Following that spec keeps traces portable when you change platform or add LLMOps tools later, and it is the same reasoning behind treating tracing as part of the build in AI integration services for agentic workflows.
Sanjay, a platform lead I worked with on a claims workflow, spent three weeks adjusting prompts before we instrumented the run. The trace showed the eligibility tool timing out at 9.8 seconds against a 10-second budget on roughly one call in twelve. The prompt was never the problem.
Per Route Cost Tracking Turns a Vague Invoice Into a Line Item
Most teams track model spend at the account level. That tells you the total rose 40% and nothing else.
Per route cost tracking attributes token spend to the workflow, tenant, and step that caused it. One agent route becomes one cost line, and a retry storm inside a single tool becomes visible the day it starts rather than at the close of the billing cycle.
What per-route cost tracking makes visible:
- Which route consumes the majority of spend, which is rarely the route the business considers most important.
- Which step inside that route is expensive, usually a retrieval step pushing too many chunks into context.
- How much of the bill is retries, which is pure waste and normally the fastest saving available.
- Cost per successful outcome rather than cost per call, which is the only figure a finance lead will accept.
I have seen a support triage route quietly account for more than half of a monthly model bill while handling under a tenth of the volume. Nobody caught it for two cycles, because the invoice showed a single number.
Cost is also a reliability signal. A step whose token count doubles week over week is accumulating context it should be pruning, and that is a correctness problem before it is a budget problem. Teams that wire this in early are usually the ones treating the path from proof of concept to production as one continuous build.
Your Agent Is Live and the Trace Store Is Empty
Most teams reach us after a bad answer they could not explain. We start by instrumenting one route end to end, then review the slowest, costliest, and silently wrong runs with your team.
How to Pick an AI Agent Observability Platform Without Buying Three
The market splits into three shapes. General APM vendors adding LLM spans, dedicated LLMOps tools built around prompts and evaluations, and agent-focused platforms built around traces and tool calls.
A short comparison of the three:
- APM extensions: Strong on infrastructure correlation, weak on prompt and evaluation detail. Useful when your failures are mostly latency and timeouts.
- LLMOps tools: Strong on prompt versioning, datasets, and evaluation. Many LLMOps tools still treat an agent run as a single unit, which defeats the purpose.
- Agent tracing platforms: Strong on nested spans and tool calls. Check cost attribution carefully, because it is the feature most often marketed and least often complete.
Five criteria I use when comparing an AI agent observability platform against the alternatives:
- Open instrumentation: Does the AI agent observability platform ingest OpenTelemetry spans, or does it require an SDK that locks your instrumentation to one vendor?
- Step granularity: Can it show a nested tool call inside a nested agent, or does it flatten everything into one run?
- Cost attribution: Does it support per-route cost tracking natively, or do you export to a warehouse and rebuild it yourself?
- Evaluation on the step: Can a judge score attach to step four, or only to the whole run?
- Residency and redaction: Can traces stay in your region, and can payloads be masked before they leave the process?
The best AI observability tools score well on all five. Plenty of otherwise capable LLMOps tools score well on evaluation and poorly on step granularity, which is the criterion that matters most for agents. Rank the criteria against your own failure history before you sit through a demo, because every vendor demo is built around the criterion that the vendor wins.
One more filter. If your agent calls systems that predate it, confirm the platform can trace across that boundary. Otherwise, the trace stops at the edge of the new stack and the hardest failures stay invisible, which is a real constraint for anyone running agents inside a wider AI-driven automation program.
The Three Traces I Review Every Week
Instrumentation without a review habit becomes storage. Reviewing traces on a schedule is where AI agent observability best practices become a working habit rather than a purchase, and a half hour on three specific traces catches more than a dashboard nobody opens.
- The slowest successful run: Sort by p95 latency and open the top trace. The slow step is usually a retrieval call or a retry loop, and it is the same step that will time out under load next quarter.
- The most expensive run: Sort by cost using per-route cost tracking and open the top trace. Read token counts per step. Context bloat shows up here long before it shows up in an answer.
- One run that reported success and was still wrong: Take a flagged case from support or a reviewer. Walk every step until you find the first output that does not match reality. That step is the bug.
Record what you find against the step type, not the run. After eight weeks, the pattern is obvious, and the team stops debating whether the model is at fault.
This habit carries governance weight too. The NIST AI Risk Management Framework places measurement and ongoing monitoring at the center of trustworthy AI, and a step-level trace is the most direct evidence a regulated team can produce that a system is monitored rather than assumed.
Build Observability In Before You Scale the Agent
Our platforms handle over 1 million data points daily across 15,000 deployed sensors and 14 live port sites. That volume only works when every step is traced, priced, and reviewable.
Where Step-Level Instrumentation Fits in a Production Build
I treat tracing as part of the build, not as a phase after launch. At ViitorCloud, the systems my team supports generate the volume that makes this decision easy. A livestock monitoring platform we built extracts over 1 million data points daily from more than 15,000 deployed sensors, and a port management system we engineered runs across 14 active sites in over 10 countries.
At that volume, an unexplained wrong answer is not an anomaly to shrug at. It is a repeating cost. The same logic applies to the healthcare platform we built that has processed $192.2M in revenue, where a silent failure in an eligibility step is a compliance event rather than a support ticket.
If you are running an agent in daily use and cannot explain last Tuesday’s bad answer, the gap is instrumentation, not model choice. Fixing that is the first thing we do when we build custom AI agents for business and when we take over an agent that is already live.
Instrument the Run Before You Touch the Prompt
Three points carry the argument. A six-step agent hides its own failure, so AI agent observability best practices have to operate at the step rather than the run. Step-level logging combined with agent tracing turns a vague complaint into a named span. Per-route cost tracking makes spend and reliability the same conversation instead of two separate meetings.
Start this week. Instrument one route end-to-end, propagate a single trace ID through every call, and record the field groups in the spec above. Then run the three trace reviews. You will find something in the first pass, and it will not be the prompt.

Vishal Shukla
Vishal Shukla is Vice President of Technology at ViitorCloud Technologies.
Frequently Asked Questions
How do you debug a multi step AI agent?
Read the trace instead of the prompt. Open the run, walk each step in order, and compare the input, output, latency, and cost of every call until you find the first output that does not match reality. That step is the bug, not the system prompt.
What should an AI agent observability platform log at every step?
What is the difference between agent tracing and normal application logging?
Do I need dedicated LLMOps tools or can I use my existing APM?
How does per route cost tracking work for an AI agent?